“There is a head-on collision in the housing market, and it is going to tie-up “traffic” for a long time says a new report from the Niagara Association of Realtors.
Born between 1946 and 1966 Baby Boomers are holding on the largest pool of residential real estate in Canada while Millennials and members of Generation Z (Gen Z) are maturing, starting families, and exploring homeownership for the first time; they are on a real estate collision course.
Rather than selling their family home and moving into alternative life-style accommodations, Baby Boomers are holding on, renovating and exploring in-home assisted living options. A recent survey by the Royal Society of Canada found that 50 per cent would prefer to renovate their current property over moving; that 75 per cent own their own home and 17 per cent own more than one property.
This aging-in-place trend is running head-on into Millennials who are starting to have families and Gen Zs who prefer home ownership over renting. They are competing in a much-reduced pool of listings for first-time home ownership and sometimes with mature equity buyers creating a tie-up in supply in one the tightest real estate markets ever recorded; a bottleneck which will likely remain until there is an increase in inventory and a return to a more normal traffic flow.
The Local Stats
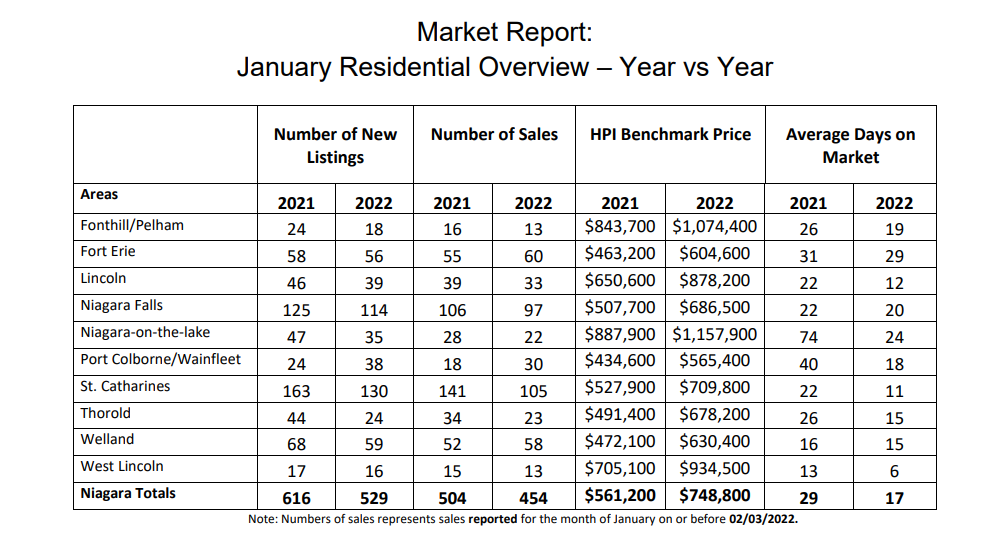
Residential home sales activity recorded through the MLS® system for The Niagara Association of REALTORS® (NAR) totaled 454 units in January 2022, compared to 504 units in January 2021.
In January, the Niagara Association of REALTORS® listed 529 residential properties compared to 616 in January 2021. The average days it took to sell a home in January 2022 was 17 days, compared to 29 days in January 2021.
The overall MLS® HPI composite benchmark price for the Niagara Region was $748,800 in January 2022. This was an increase of 33.4% compared to January 2021.
The characteristics of the HPI composite benchmark is a home between the age of 51 to 99 with three bedrooms and two bathrooms.
The chart below breaks down the various statistics within different regions.
For more information visit the NARS website HERE.


